
Understanding your email campaign statistics
Learn how to interpret sent emails, opens, clicks, bounces, unsubscribes, and spam reports in Sendora to improve future campaigns.
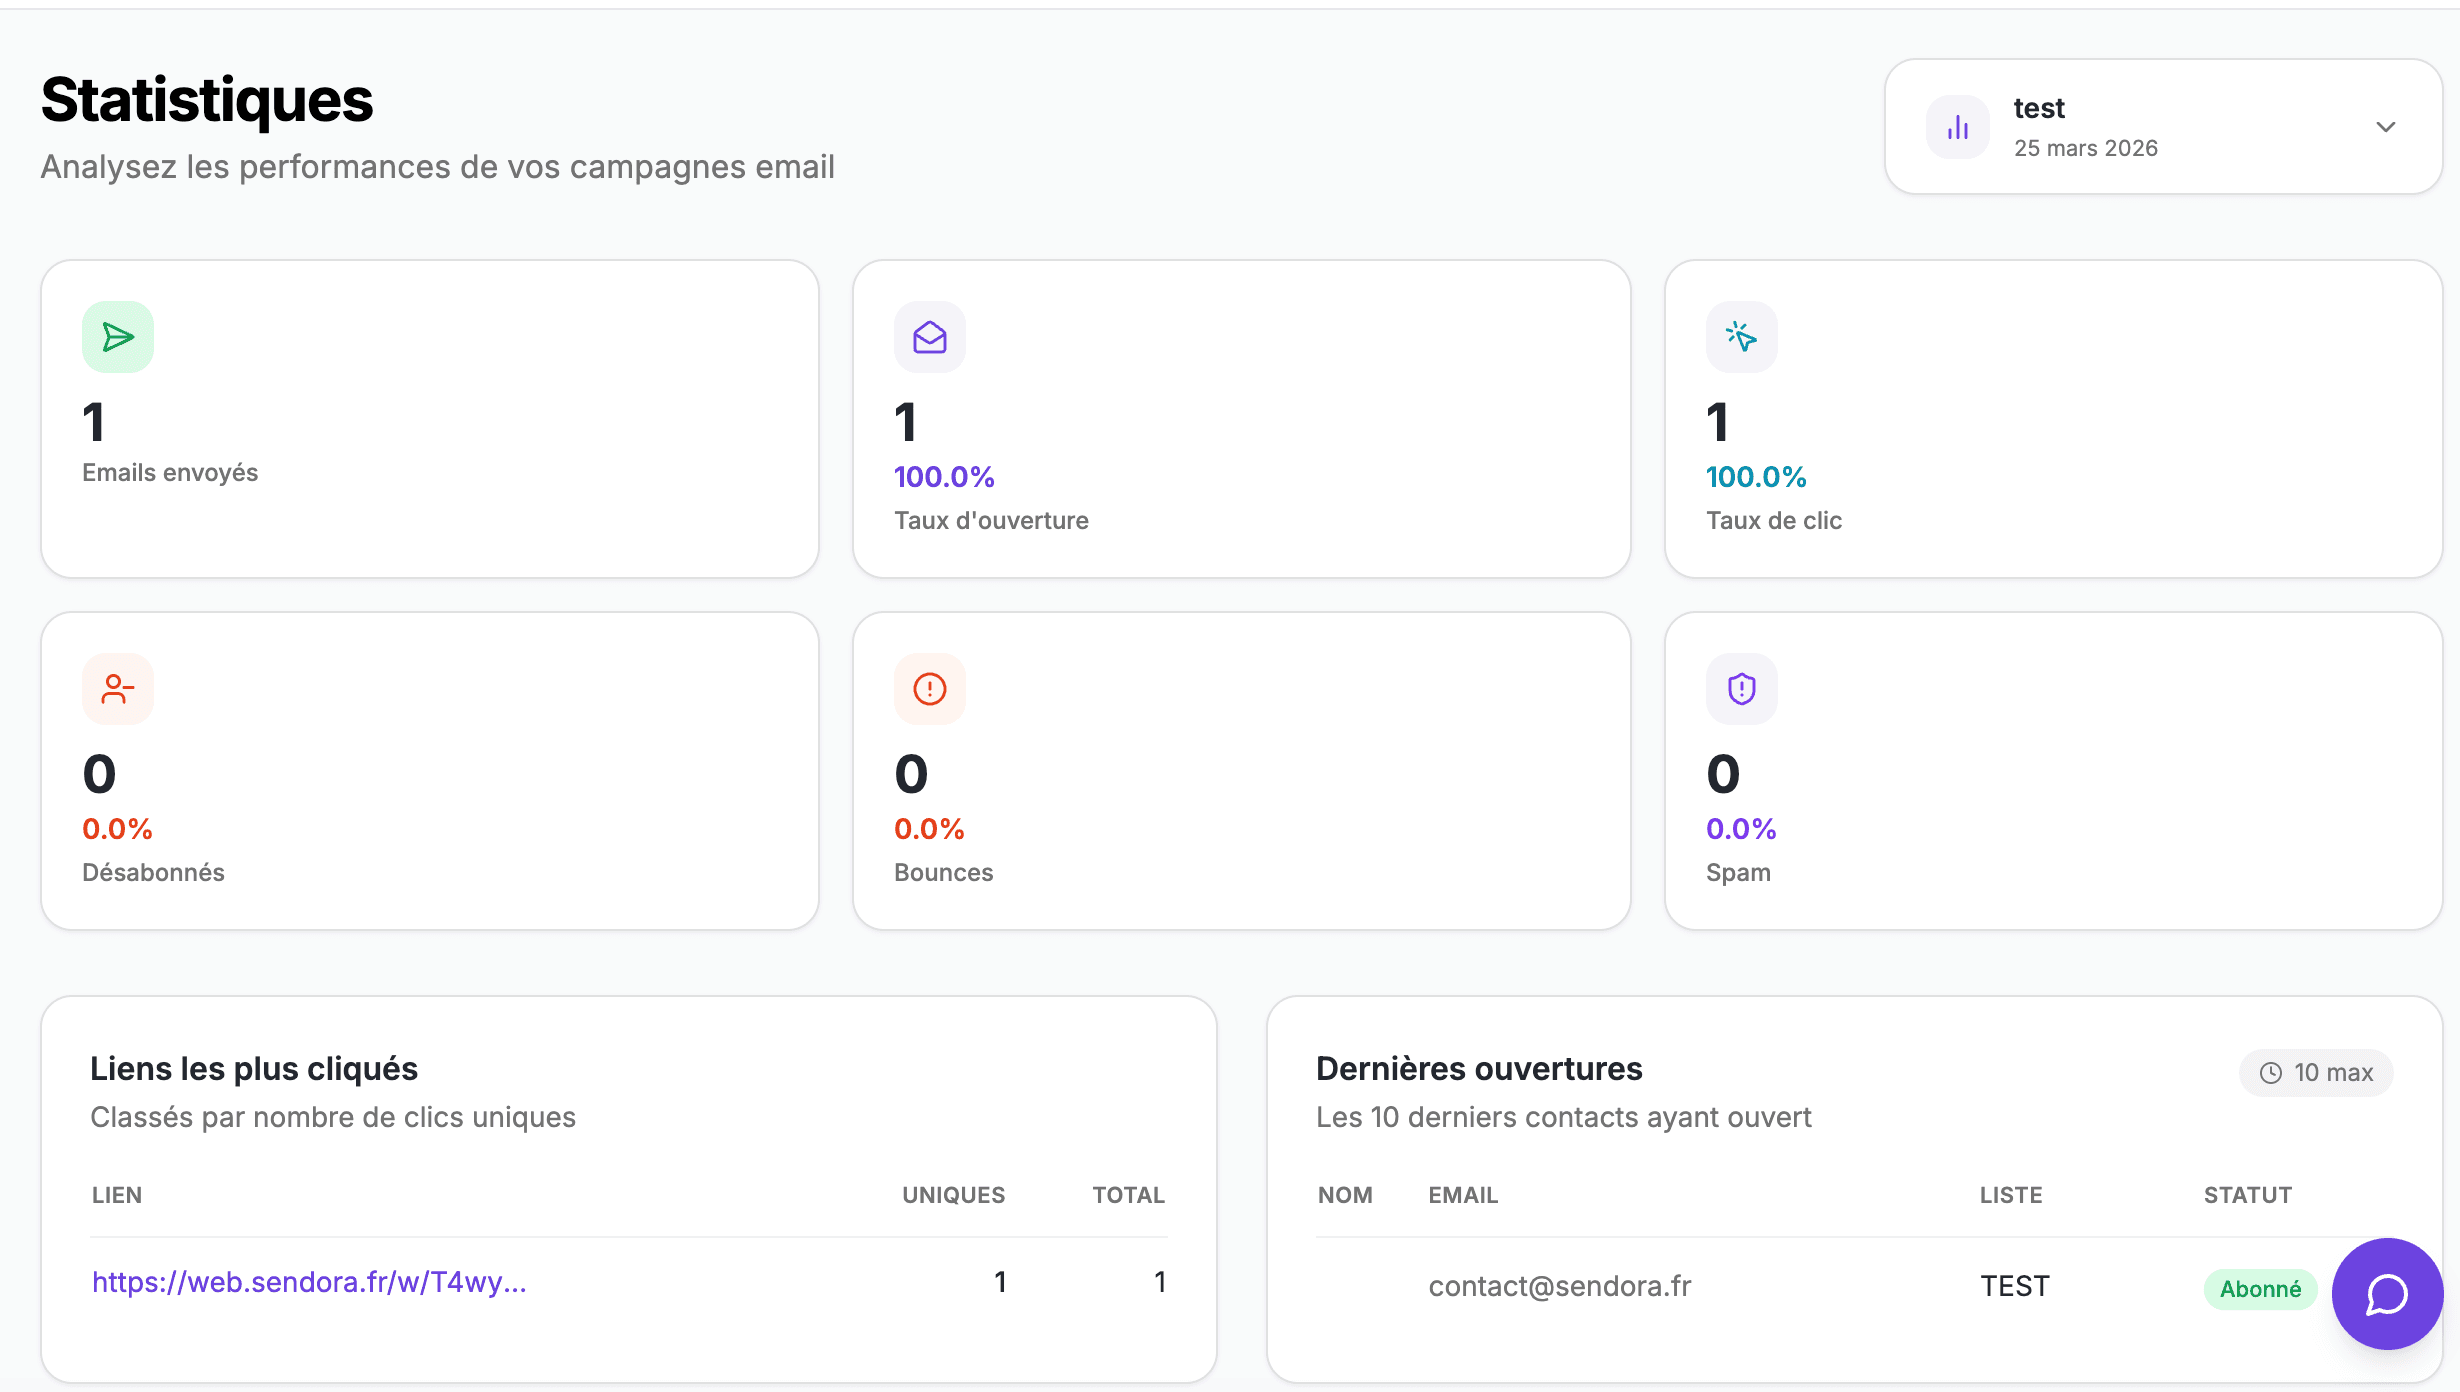
Statistics explain what happens after sending: how many messages went out, which ones generated an open or click, and which signals may reveal a list or deliverability issue. Their main value is helping you compare campaigns and improve one element at a time.
A good campaign is not simply one with a high rate. It is one that achieves its goal, such as replies, bookings, quotes, donations, or sales, without damaging list quality.
When should you review results?
Data begins appearing after the send and continues changing as recipients read messages. Wait at least 24 hours for an initial review, then check again after 48 to 72 hours. Campaigns tied to events or longer decisions can continue generating clicks for several days.
Select the relevant campaign on the Statistics page. You can follow activity over 24 hours, 7 days, or one month and display opens, clicks, bounces, unsubscribes, and spam reports separately.
Sent and delivered emails
Sent emails is the volume processed for the campaign. Sending does not guarantee placement in the primary inbox. A mailbox provider may accept the message, route it to spam, or reject it.
Estimate delivery by subtracting bounces from sent emails. For example, 1,000 sent emails and 15 bounces mean about 985 accepted messages, or 98.5%. This does not distinguish the primary inbox from the spam folder.
Open rate
Open rate estimates the proportion of delivered messages that were opened. It provides a trend for sender recognition, subject line, preview text, and send timing.
Opens are detected through a tiny invisible image. Some clients block it, while privacy protections such as Apple Mail Privacy Protection may load it automatically. The rate can therefore be understated or artificially inflated. Treat it as a trend, not an exact reader count.
Click rate and most-clicked links
Click rate measures the proportion of emails that generated at least one click. It is generally more reliable and closer to real intent than opens. Strong opens with very few clicks can mean the content, offer, or button failed to deliver on the subject line's promise.
Most-clicked links reveals which destinations attracted attention. Check whether the primary button ranks first. If a secondary link receives more clicks, the audience's real need may differ from your assumption.
Bounces
A bounce means delivery failed. A nonexistent address, invalid domain, or deleted mailbox usually creates a permanent error. A full inbox or temporary server problem can create a temporary error.
Investigate rising bounces quickly. Review imported contacts, avoid purchased or stale files, and use Sendora's optional email verification credits before an important send. A clean list protects sender reputation.
Unsubscribes
Some unsubscribes are normal because needs change. Sendora excludes these contacts from future campaigns. Never re-import them to override their choice.
A sudden increase can indicate excessive frequency, content that differs from the original promise, or targeting that is too broad. Compare the result with previous campaigns before changing strategy.
Spam reports
A spam report occurs when a recipient marks the message as unwanted. Mailbox providers treat it as a particularly sensitive signal. Google advises keeping the rate shown in Postmaster Tools below 0.1% and requires it to remain below 0.3% for Gmail delivery.
If complaints appear, do not keep sending to the same audience without investigating. Check contact sources, sender identity, frequency, and unsubscribe visibility. Review the official Gmail sender guidelines.
What numbers suggest a healthy campaign?
There is no universal threshold. Industry, message type, list quality, frequency, and audience relationship all affect results. For a newsletter sent to a legitimate and active list, these broad ranges can provide an initial reference, not a guarantee:
Opens
about 20 to 40%
interpret cautiously
Clicks
about 1 to 4%
depends on the offer and CTA
Bounces
ideally below 2%
lower with a recent list
Unsubscribes
often below 0.5%
some churn is normal
Spam reports
aim below 0.1%
never reach 0.3%
Large-volume benchmark reports frequently place click rates in the low single digits, but averages are not personalized targets. Your best benchmark is the median result from your last five to ten comparable campaigns.
How to diagnose a campaign
Few opens
Review list quality, sender name, subject line, preview text, frequency, and domain authentication.
Opens but few clicks
The content or button may not convince readers. Clarify the offer, remove distractions, and make the message match the subject line.
Clicks but few business results
Review the landing page, offer consistency, form simplicity, and conversion tracking outside Sendora.
Many bounces
Pause sends to this list, verify addresses, and remove stale or invalid contacts before trying again.
More unsubscribes or complaints
Review contact sources, targeting, frequency, and whether the message matches what subscribers agreed to receive.
Prepare the next campaign
Record the original goal and choose one improvement: a new subject, more precise segment, clearer button, different offer, or cleaner list. Changing everything at once prevents you from understanding what worked.
Review trends across several sends. One unusual result may come from the topic or calendar; a repeated decline more likely indicates a relevance, list, or deliverability problem.